| |
Energy is essential to drive the production of any process. In today's competitive world, the operation must be top-of-the-line. This means the highest level of energy efficiency must be achieved.
"CWB Techs Utility Plant Model provided a great deal of insight into the operation of Japan Energys utility plant. Not only were we able to achieve a more efficient operation, but also plan effectively for future capacity increases."
Katsuyuki Sasaki
Senior Process Engineer
Mizushima Oil Refinery
Japan Energy Corporation
What is Total Site Analysis?
In a chemicals complex, there are many chemical plants. Some of them make the final products, whereas others make intermediate products which are consumed within the production site. All of these process plants consume energy in the form of steam or power. A utility plant generates the steam and electricity required to support the production. The demand for utilities varies with the production capacity of the various plants at the site. An additional level of interaction exists due to the possible recycle of by-products from the process plants as fuel to the utility plant. Because of the varying cost of fuel and power, and the varying utilities demand, the operation of the utility plant needs to be constantly tuned to achieve optimum operation. Total Site Analysis can model all the interactions in the utility and the production plants and capture the significant potential present here.
We have a new energy management tool that can address your energy needs.
What can our Total Site Model do for you?
A Total Site Model can be used in many ways depending on the level of detail included during the modeling. It can be used to optimize the day to day operations of the utility plant. It also serves as an invaluable tool in making strategic and long term decisions. CWB Techs Total Site software also provides various options for marginal cost calculation and sensitivity analysis, which can be used to do case studies and what if analysis. Following are some of the ways that a Total Site analysis can help you to achieve a higher level of performance for your utility plant and production site.
Optimize and manage utilities production
- Optimize the hourly steam and power production to minimize costs
- Optimize Boiler and Turbine loadings
- Optimize the power generated in-house versus that purchased from outside
- Maximize the use of the most efficient equipment
- Choose correct fuels in each boiler
- Reduce let-downs and venting of steam
Analysis and Case Studies
- Where are the bottlenecks in the current utility plant, and how should the existing configuration be modified?
- How can we plan for the utilities production for today, tomorrow, or next month.
- What is the correct price of steam at various levels? How does it change with the steam demand?
- What is the impact of startup or shutdown of certain plants or equipment?
Strategic and Business Decisions
- Evaluate the economics of proposed process-efficiency or capacity improvement projects
- Enable more effective negotiations with third party independent power producers
- Enable decision making for production planning, site-wide maintenance scheduling, product pricing, and others
|
|
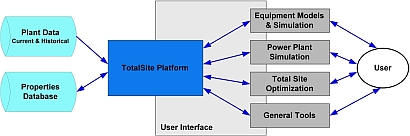
Interface for Total Site
|
To find out what our Total Site Energy Management tool can do for you click here
Introduction
Pinch Analysis is designed to deal with the problem of improving the energy efficiency of individual process plants in a plant site. Total Site Energy Management and Pinch Analysis address the two important problems that comprise the Total Site Analysis.
The Benefits
With Pinch Analysis the user can:
- Analyze the efficiency of the process
- Identify the cross-pinch exchangers and the cross-pinch duties
- Select the optimum levels of utility for the process
Workflow
The following workflow is adopted in Pinch Analysis:
- Stream Data Extraction:
- Based on the heat and material balance of the system, the necessary stream data needs be extracted. Correct data about the process streams has to be extracted, rather than just on existing heat exchangers. This data can be input to a pinch analysis tool.
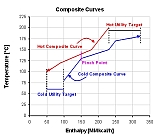
- Construct and Study the Pinch Diagram or the T-Q diagram:
- Study pinch diagrams to determine energy target. T-Q diagrams are plots of enthalpy vs. Temperature of the various process streams. Composite curves, which are plots of Temperature vs. Cumulative heat flow, are constructed for hot and cold streams. For a given deltaTmin, the minimum heating and cooling requirements can be read from the composite curves
Click the image for a larger view.
 |
 |
| Composite Curves and Pinch |
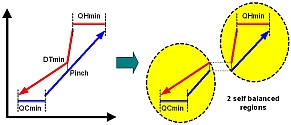
- Study the Maximum Heat Recovery Design
- The objective is to optimize the heat recovery and integration in the process, and design the appropriate heat exchanger network (HEN). Additionally, the appropriate mix of utilities for the process can be decided.
- In the network design, heat exchanger matches for appropriate exchangers are determined. The process and utility pinches, and cross-pinch heat exchangers are identified.
- Determine the Area Target
- By calculating the area requirement for all exchangers, an estimate of the capital cost can be obtained
- Determine the Utility Target
- In reality, multiple utilities are required to meet the energy needs of a process. A study of the T vs. Enthalpy of the process can be done on a combined plot called as Grand Composite Curve. It is a helpful tool in deciding the targeting and placement of utility levels.
Pinch technology provides the guidelines for an appropriately heat integrated process design
|
|
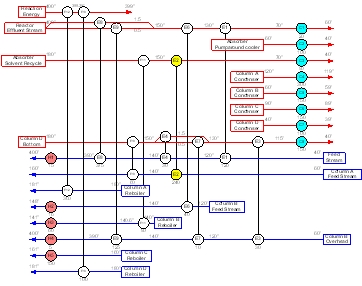
Heat-Exchanger Network
|
Reference Publications
- K. Hirata, H. Sakamoto, K.Y. Cheung, L. OYoung, and C.W. Hui, "Simultaneous Site-Wide Energy, Waste and Production Optimization Industrial Case Studies," European Symposium on Computer Aided Process Engineering-14, Lisbon, Portugal, A. Barbosa-Povoa and H. Matos, eds, Elsevier, Amsterdam, pp.925-930 (2004)
- K. Hirata, H. Sakamoto, L. O'Young, K. Y. Cheung, and C. W. Hui, "Multi-Site Utility integration--an Industrial Case Study," Computers & Chemical Engineering, 28, 139-148 (2004).
- K. Y. Cheung, C. W. Hui, H. Sakamoto, K. Hirata, and L. O'Young, "Short-Term Site-Wide Maintenance Scheduling,"
Computers & Chemical Engineering, 28, 91-102 (2004).
- K. Y. Cheung, W. K. Li, C. W. Hui, H. Sakamoto, and L. O'Young, "Universal Plant Model for Production Planning," Proceeding of the 5th Conference of Process Integration Modeling and Optimisation for Energy Saving and Pollution Reduction (PRES'02), Prague (2002).
- K. Y. Cheung, and C. W. Hui, "Total-Site Maintenance Scheduling", Proceedings of the 4th Conference on Process Integration, Modeling, and Optimization for Energy Saving and Pollution Reduction (PRES'01),
Florence, Italy (2001).
- C. W. Hui, "Determining Marginal Values of Intermediate Materials and Utilities Using a Site Model", Computers & Chemical Engineering, 24(2-7), 1023 (2000).
If you would like to request a copy of any of the above papers, please Click here.
|
|
More Info |